Inhalt:
Optimale Datenstruktur (Datenbank):
| Kategorie | Y-Achse | X-Achse |
|---|
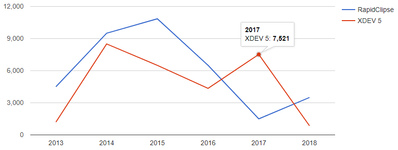
| RapidClipseKunden | 2013 | 4500 |
| RapidClipseKunden | 2014 | 9500 |
| RapidClipseKunden | 2015 | 10850 |
| ... |
|
|
| XDEV 5Verkäufe | 2013 | 1200 |
| XDEV 5Verkäufe | 2014 | 8500 |
| ... |
|
|
Optimale Objektstruktur (Java):
| Code Block |
|---|
| language | java |
|---|
| theme | Eclipse |
|---|
| firstline | 1 |
|---|
| linenumbers | true |
|---|
|
public class LineChartObject {

	private String category;
	private String y_axis;
	private Integer x_axis;

	public String getCategory() {
		return this.category;
	}

	public void setCategory(final String category) {
		this.category = category;
	}

	public String getY_axis() {
		return this.y_axis;
	}

	public void setY_axis(final String y_axis) {
		this.y_axis = y_axis;
	}

	public Integer getX_axis() {
		return this.x_axis;
	}

	public void setX_axis(final Integer x_axis) {
		this.x_axis = x_axis;
	}
} |
Beispiel füllen der Daten:
| Code Block |
|---|
| language | java |
|---|
| theme | Eclipse |
|---|
| firstline | 1 |
|---|
| linenumbers | true |
|---|
|
//Erstellen Model und hinzufügen der Kategorien
XdevLineChartModelfinal ChartModel model = new XdevLineChartModelChartModel.New();
    model.addXCategory("Year", ColumnType.STRING);
model.addYCategory("RapidClipse");
model.addYCategory("XDEV 5");

//Füllen der Items
model.addItem("RapidClipse", "2013", 4500);
model.addItem("RapidClipse", "2014", 9500);
model.addItem("RapidClipse", "2015", 10850);
model.addItem("RapidClipse", "2016", 6500);
model.addItem("RapidClipse", "2017", 1500);
model.addItem("RapidClipse", "2018", 3500);

model.addItem("XDEV 5", "2013", 1200);
model.addItem("XDEV 5", "2014", 8500);
model.addItem("XDEV 5", "2015", 6500);
model.addItem("XDEV 5", "2016", 4350);
model.addItem("XDEV 5", "2017", 7521);
model.addItem("XDEV 5", "2018", 850);.addColumn(Column.New(Type.STRING, "year", "Jahr"))
    .addColumn(Column.New(Type.NUMBER, "sales", "Verkäufe"))
    .addColumn(Column.New(Type.NUMBER, "customer", "Kunden"));

//Füllen der Items
model.addRow("2013", "6500", 6500);
model.addRow("2014", "4321", 4321);
model.addRow("2015", "9460", 9460);
model.addRow("2016", "7450", 7450);

model.addRow("2013", "1500", 1500);
model.addRow("2014", "2850", 2850);
model.addRow("2015", "685", 685);
model.addRow("2016", "4850", 4850);

//Setzen des Models
lineChart.setModel(model); |
API und Methoden:
...
| Properties |
|
|---|
| PointShape | The shape of individual data elements: 'circle', 'triangle', 'square', 'diamond', 'star', or 'polygon'. |
...
model.addXCategory("Year");

//Parameter 1 ("Year"): definiert die Beschriftung der X-Achse

model.addYCategory("RapidClipse");
model.addYCategory("XDEV 5");

//Parameter 1 ("RapidClipse"): definiert die Beschriftung und wird als Mapping Parameter und Gruppierung verwendet wird
...
lineChart.setPointShape(PointShape.New(PointShape.Type.CIRCLE)); |
For detailed informations see: https://developers.google.com/chart/interactive/docs/points |
| PointSize | Diameter of displayed points in pixels. Use zero to hide all points. You can override values for individual series using the series property. If you're using a trendline, the pointSize option will affect the width of the trendline unless you override it with the trendlines.n.pointsize option. |
...
model.addItem("RapidClipse", "2013", 4500);

//Parameter 1 ("RapidClipse"): Wert, welchen in der X-Achse angezeigt werden soll
//Parameter 2 ("2013"): Zuweisung zur jeweiligen vorher festgelegten Kategorie (Kategoriemapping)
//Parameter 3 (4500): Wert für die Y-Achse. Zulässige Datentypen: Integer, Double
lineChart.setPointSize(5); |
|
| PointVisible | Determines whether points will be displayed. Set to false to hide all points. |
...
XdevLineChartConfig config = new XdevLineChartConfig();
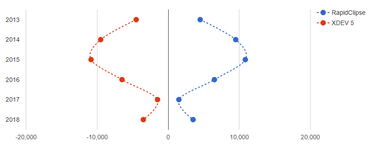
config.setOrientation(Options.ORIENTATION_VERTICAL); //Ausrichtung des Charts. Mögliche Werte: Options.ORIENTATION_VERTICAL, Options.ORIENTATION_HORIZONTAL
...
lineChart.setPointsVisible(true); |
|
| LineDashStyle | The on-and-off pattern for dashed lines. For instance, [4, 4] will repeat 4-length dashes followed by 4-length gaps, and [5, 1, 3] will repeat a 5-length dash, a 1-length gap, a 3-length dash, a 5-length gap, a 1-length dash, and a 3-length gap. See Dashed Lines for more information. |
...
lineChart.setLineDashStyle(Arrays.asList(4,4,4) |
|
...
|
| LineWidth | Data line width in pixels. Use zero to hide all lines and show only the points. You can override values for individual series using the series property. | Code Block |
|---|
| lineChart.setLineWidth(5); |
|
| CurveType | Controls the curve of the lines when the line width is not zero. Can be one of the following: |
...
XdevLineChartConfig config = new XdevLineChartConfig();

final ChartArea area = new ChartArea();

area.setHeigth("100"); //Höhe des Chart
area.setWidth("100"); //Breite des Chart
area.setLeft("100"); //Abstand des Chart von Links in Pixel
area.setRight("100"); //Abstand des Chart von Links in Pixel
area.setTop("100"); //Abstand des Chart von Links in Pixel

config.setChartArea(area);
...
lineChart.setCurveType(CurveType.FUNCTION); |
|
| SelectionMode | When selectionMode is 'multiple', users may select multiple data points. |
...
XdevLineChartConfig config = new XdevLineChartConfig();

config.setBackgroundColor(...); //Siehe API Allgemein "BackgroundStyle"

//Eine Liste an Farben die dann der Reihe nach an die Kategorien vergeben werden
List<String> places = Arrays.asList("#FFFFFF", "Red", "#F4g6uz");
config.setColors(places); //Zuweisen der Farbliste
...
lineChart.setSelectionMode(SelectionMode.MULTIPLE); |
|
| Orientation | The orientation of the chart. When set to 'vertical', rotates the axes of the chart so that (for instance) a column chart becomes a bar chart, and an area chart grows rightward instead of up: |
...
XdevLineChartConfig config = new XdevLineChartConfig();

config.setLegend(...); //Siehe API Allgemein "LegendOptions"
config.setTitleTextStyle(...); //Siehe API Allgemein "TextStyle"
config.setFontName(""); //Wahl der Schriftart (Schriftart muss vom Browser unterstützt werden)
config.setFontSize(15); //Setzen allgemeine Schriftgröße im Chart
config.setTitle("Sales Overview"); //Setzen ChartTitel
...
lineChart.setOrientation(Orientation.HORIZONTAL); |
|
| DataOpacity | The transparency of data points, with 1.0 being completely opaque and 0.0 fully transparent. |
...
lineChart.setCurveType(CurveType.FUNCTION); |
|