Beispiel:
Inhalt:
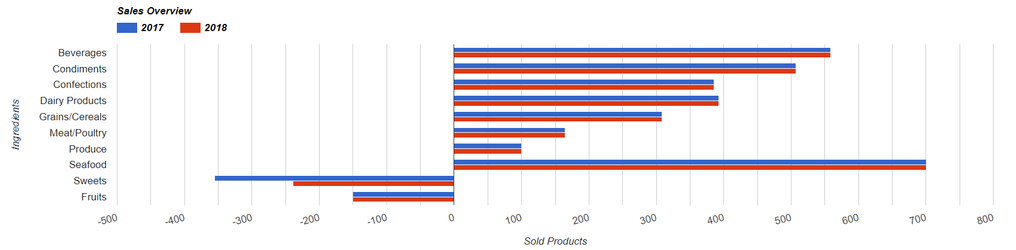
Optimale Datenstruktur (Datenbank):
| Y-Achse | Kategorie | X-Achse |
|---|
| Beverages | 2017 | 550 |
| Beverages | 2018 | 550 |
...
| Code Block |
|---|
| language | java |
|---|
| theme | Eclipse |
|---|
| firstline | 1 |
|---|
| linenumbers | true |
|---|
|
public class BarChartObject {

	private String yvalue;
	private String category;
	private Integer xvalue;

	public String getYvalue() {
		return this.yvalue;
	}

	public void setYvalue(final String yvalue) {
		this.yvalue = yvalue;
	}

	public String getCategory() {
		return this.category;
	}

	public void setCategory(final String category) {
		this.category = category;
	}

	public Integer getXvalue() {
		return this.xvalue;
	}

	public void setXvalue(final Integer xvalue) {
		this.xvalue = xvalue;
	}
} |
Beispiel füllen der Daten:
| Code Block |
|---|
| language | java |
|---|
| theme | Eclipse |
|---|
| firstline | 1 |
|---|
| linenumbers | true |
|---|
|
//Erstellen Model und hinzufügen der Kategorien
final ChartModel model = ChartModel.New()
	.addColumn(Column.New(Type.STRING, "year", "Jahr"))
	.addColumn(Column.New(Type.NUMBER, "iphone", "iPhone"))
	.addColumn(Column.New(Type.NUMBER, "android", "Android"));

//Füllen der Items
model.addRow("2014", 1500, 1200);
model.addRow("2015", 805, 700);
model.addRow("2016", 920, 600);
model.addRow("2017", 1250, 1500);

//Setzen des Models
barChart.setModel(model); |
Optionen und Properties:
Konfiguration allgemein
API und Methoden:
| Properties |
|
|---|
| Orientation | The orientation of the chart. When set to'vertical', rotates the axes of the chart so that (for instance) a column chart becomes a bar chart, and an area chart grows rightward instead of up: | Code Block |
|---|
| this.barChart.setOrientation(Orientation.VERTICAL); |
|
| StackMode | The options for isStacked are: false — elements will not stack. This is the default option.true — stacks elements for all series at each domain value.'percent' — stacks elements for all series at each domain value and rescales them such that they add up to 100%, with each element's value calculated as a percentage of 100%.'relative' — stacks elements for all series at each domain value and rescales them such that they add up to 1, with each element's value calculated as a fraction of 1.'absolute' — functions the same as isStacked: true.
| Code Block |
|---|
| this.barChart.setStackMode(StackMode.TRUE); |
|
Achsenkonfiguration
...
Where to place the axis titles, compared to the chart area. Supported values:
| Code Block |
|---|
|
barChart.setAxisTitlesPosition(AxisTitlesPosition.IN); |
...
An object with members to configure various horizontal axis elements. To specify properties of this object, you can use object literal notation, as shown here:
| Code Block |
|---|
| language | java |
|---|
| theme | Eclipse |
|---|
| firstline | 1 |
|---|
| linenumbers | true |
|---|
|
Axis haxis= Axis.Builder()
	.slantedText(true)
	.direction(Direction.REVERSE)
	.minorGridlines(GridLines.New("red", 5))
	.format("currency").build();

barChart.setHAxis(haxis);
|
More detailed information about Axis see: https://developers.google.com/chart/interactive/docs/gallery/barchart#bar-styles
...
| Properties | colors | The colors to use for the chart elements. An array of strings, where each element is an HTML color string, for example:colors:['red','#004411'].
| Code Block |
|---|
|
List<String> colors= Arrays.asList("#FFFFFF", "Red", "#F4g6uz");
barChart.setColors(colorsKonfiguration von Texten und Legenden siehe API Allgemein
...