Inhalt:
Anmerkung: Beide Charts XdevAreaChart und XdevSteppedAreaChart besitzen die selben Implementierungen. Es ändern sich nur die Name, die Einstellungen sind aber identisch.
Optimale Datenstruktur (Datenbank):| Kategorie | Y-Achse | X-Achse |
|---|
| Kunden | 2013 | 4500 |
| Kunden | 2014 | 9500 |
| Kunden | 2015 | 10850 |
| ... |
|
|
| Verkäufe | 2013 | 1200 |
| Verkäufe | 2014 | 8500 |
| ... |
|
|
Optimale Objektstruktur (Java)
| Code Block |
|---|
| language | java |
|---|
| theme | Eclipse |
|---|
| firstline | 1 |
|---|
| linenumbers | true |
|---|
|
public class AreaChartObject {
	private String category;
	private String y_axis;
	private Integer x_axis;

	public String getCategory() {
		return this.category;
	}

	public void setCategory(final String category) {
		this.category = category;
	}

	public String getY_axis() {
		return this.y_axis;
	}

	public void setY_axis(final String y_axis) {
		this.y_axis = y_axis;
	}

	public Integer getX_axis() {
		return this.x_axis;
	}

	public void setX_axis(final Integer x_axis) {
		this.x_axis = x_axis;
	}
} |
Beispiel: Füllen der Daten| Code Block |
|---|
| language | java |
|---|
| theme | Eclipse |
|---|
| firstline | 1 |
|---|
| linenumbers | true |
|---|
|
//Erstellen Model und hinzufügen der Kategorien
final ChartModel model = ChartModel.New()
.addColumn(Column.New(Type.STRING, "year", "Jahr"))
.addColumn(Column.New(Type.NUMBER, "sales", "Verkäufe"))
.addColumn(Column.New(Type.NUMBER, "customer", "Kunden"));
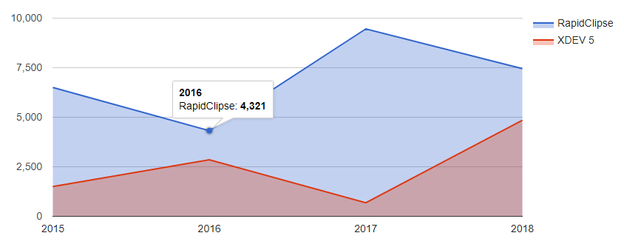
//Füllen der Items
model.addRow("2013", "6500", 6500);
model.addRow("2014", "4321", 4321);
model.addRow("2015", "9460", 9460);
model.addRow("2016", "7450", 7450);
model.addRow("2013", "1500", 1500);
model.addRow("2014", "2850", 2850);
model.addRow("2015", "685", 685);
model.addRow("2016", "4850", 4850);
//Setzen des Models
areaChart.setModel(model); |
API und Methoden:
Konfiguration Linien und Punkte| Properties |
|
|---|
| PointShape | The shape of individual data elements: 'circle', 'triangle', 'square', 'diamond', 'star', or 'polygon'. | Code Block |
|---|
| areaChart.setPointShape(PointShape.New(PointShape.Type.CIRCLE)); |
For detailed informations see: https://developers.google.com/chart/interactive/docs/points |
| PointSize | Diameter of displayed points in pixels. Use zero to hide all points. You can override values for individual series using the series property. If you're using a trendline, the pointSize option will affect the width of the trendline unless you override it with the trendlines.n.pointsize option. | Code Block |
|---|
| areaChart.setPointSize(5); |
|
| PointVisible | Determines whether points will be displayed. Set to false to hide all points. | Code Block |
|---|
| areaChart.setPointsVisible(true); |
|
| LineDashStyle | The on-and-off pattern for dashed lines. For instance, [4, 4] will repeat 4-length dashes followed by 4-length gaps, and [5, 1, 3] will repeat a 5-length dash, a 1-length gap, a 3-length dash, a 5-length gap, a 1-length dash, and a 3-length gap. See Dashed Lines for more information. | Code Block |
|---|
| areaChart.setLineDashStyle(Arrays.asList(4,4,4)); |
|
| LineWidth | Data line width in pixels. Use zero to hide all lines and show only the points. You can override values for individual series using the series property. | Code Block |
|---|
| areaChart.setLineWidth(5); |
|
| SelectionMode | When selectionMode is 'multiple', users may select multiple data points. | Code Block |
|---|
| areaChart.setSelectionMode(SelectionMode.MULTIPLE); |
|
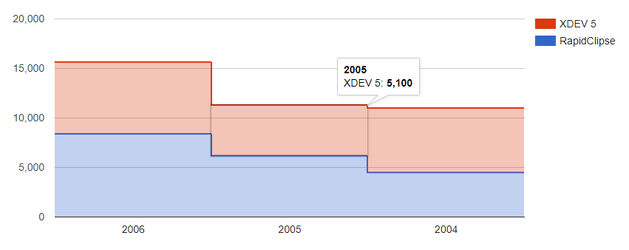
| Orientation | The orientation of the chart. When set to 'vertical', rotates the axes of the chart so that (for instance) a column chart becomes a bar chart, and an area chart grows rightward instead of up: | Code Block |
|---|
| areaChart.setOrientation(Orientation.HORIZONTAL); |
|
| DataOpacity | The transparency of data points, with 1.0 being completely opaque and 0.0 fully transparent. | Code Block |
|---|
| areaChart.setDataOpacity(0.8); |
|
...