Inhalt:
Optimale Datenstruktur (Datenbank)
...
| Code Block |
|---|
| language | java |
|---|
| theme | Eclipse |
|---|
| firstline | 1 |
|---|
| linenumbers | true |
|---|
|
final ChartModel model = ChartModel.New()
	.addColumn(Column.New(Type.STRING))
	.addColumn(Column.New(Type.NUMBER));

new ProductDAO().getProductsByCategoryForChart().forEach(p -> {
       model.addRow(p.getCategory().getCategoryname(), (int)p.getAmount());
});

chart.setModel(model);
|
API und Methoden:
Positionierung und Größe des Pie innerhalb des ChartbereichsKonfiguration "XdevPieChartConfig" allgemein:| Properties |
|
|---|
| PieHole | If between 0 and 1, displays a donut chart. The hole with have a radius equal to number times the radius of the chart. |
...
XdevPieChartConfig config = new XdevPieChartConfig();

final ChartArea area = new ChartArea();

area.setHeigth("100"); //Höhe des Pie
area.setWidth("100"); //Breite des Pie
area.setLeft("100"); //Abstand des Pie von Links in Pixel
area.setRight("100"); //Abstand des Pie von Links in Pixel
area.setTop("100"); //Abstand des Pie von Links in Pixel

config.setChartArea(area);
...
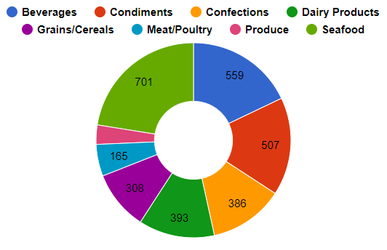
pieChart.setPieHole(0.5); |
|
| PieStartAngle | The angle, in degrees, to rotate the chart by. The default of 0 will orient the leftmost edge of the first slice directly up. |
...
config.setIs3D(false); //3D Darstellung ein- oder ausschalten
config.setPieHole(0.4); //Darstellung als Donut-Chart ein- oder ausschalten. Wert zwischen 0 und 1 in Abhängigkeit des Pie Radius
config.setPieStartAngle(3); //Drehung des PieCharts in Grad
...
pieChart.setPieStartAngle(60); |
|
| PieSliceBorderColor | The color of the slice borders. Only applicable when the chart is two-dimensional. |
...
pieChart.setPieSliceBorderColor(" |
|
...
...
|
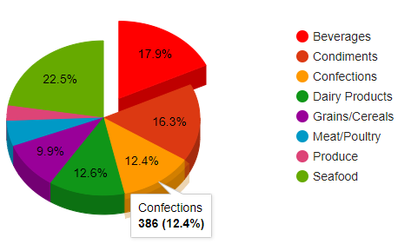
| PieSliceText | The content of the text displayed on the slice. Can be one of the following: - 'percentage' - The percentage of the slice size out of the total.
- 'value' - The quantitative value of the slice.
- 'label' - The name of the slice.
'none' - No text is displayed |
...
...
pieChart.setPieSliceText(PieSliceText.PERCENTAGE); |
|
...
|
| SliceVisibilityThreshold | The fractional value of the pie, below which a slice will not show individually. All slices that have not passed this threshold will be combined to a single "Other" slice, whose size is the sum of all their sizes. Default is not to show individually any slice which is smaller than half a degree. |
...
//Grenze für die Zusammenfassung mehrerer Slices. Kategorien welche einen bestimmte prozentuellen Wert nicht Überschreiten
//werden zu einem Slice zusammengefasst und als "Other" aufgeführt. Mögliche Werte 0 und 1 bezogen auf den prozentuellen Anteil.
config.setSliceVisibilityThreshold(0.15);
config.setPieResidueSliceLabel("Sonstige"); //Setzen des Titels für die zusammengefassten Kategorien Default: "Others"
...
pieChart.setSliceVisibilityThreshold(25); |
|
| Is3D | If true, displays a three-dimensional chart. |
...