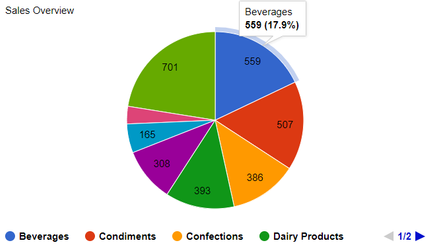
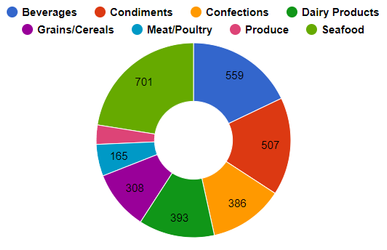
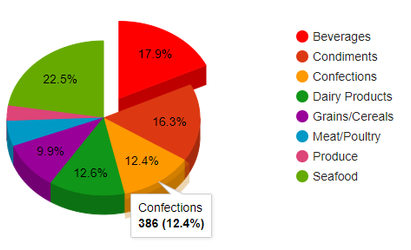
PieChart
Inhalt:
Optimale Datenstruktur (Datenbank)
| Kategory | Wert |
|---|---|
| Bverages | 393 |
| Condiments | 507 |
| Confections | 386 |
Optimale Objektstruktur (Java)
public class PieChartObject {
	private String category;
	private Integer value;

	public String getCategory() {
		return this.category;
	}

	public void setCategory(final String category) {
		this.category = category;
	}

	public Integer getValue() {
		return this.value;
	}

	public void setValue(final Integer value) {
		this.value = value;
	}
}
Beispiel: Füllen der Daten
final ChartModel model = ChartModel.New()
	.addColumn(Column.New(Type.STRING))
	.addColumn(Column.New(Type.NUMBER));

model.addRow("Katze", 50);
model.addRow("Hund", 25);
model.addRow("Schlange", 25);

this.pieChart.setModel(model);
oder per Schleife aus Query-Methode:
final ChartModel model = ChartModel.New()
	.addColumn(Column.New(Type.STRING))
	.addColumn(Column.New(Type.NUMBER));

new ProductDAO().getProductsByCategoryForChart().forEach(p -> {
       model.addRow(p.getCategory().getCategoryname(), (int)p.getAmount());
});

chart.setModel(model);
API und Methoden:
Konfiguration "XdevPieChartConfig" allgemein:
| Properties | |
|---|---|
| PieHole | If between 0 and 1, displays a donut chart. The hole with have a radius equal to pieChart.setPieHole(0.5); |
| PieStartAngle | The angle, in degrees, to rotate the chart by. The default of pieChart.setPieStartAngle(60); |
| PieSliceBorderColor | The color of the slice borders. Only applicable when the chart is two-dimensional. pieChart.setPieSliceBorderColor("red");
|
| PieSliceText | The content of the text displayed on the slice. Can be one of the following:
'none' - No text is displayed pieChart.setPieSliceText(PieSliceText.PERCENTAGE); |
| SliceVisibilityThreshold | The fractional value of the pie, below which a slice will not show individually. All slices that have not passed this threshold will be combined to a single "Other" slice, whose size is the sum of all their sizes. Default is not to show individually any slice which is smaller than half a degree. pieChart.setSliceVisibilityThreshold(25); |
| Is3D | If true, displays a three-dimensional chart. pieChart.setIs3D(true); |
XDEV Software Corp. - One Embarcadero Center, San Francisco, CA 94111, US
Copyright © 2015. XDEV Software Corp. All rights reserved.