/
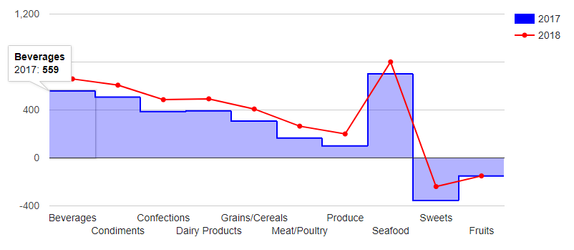
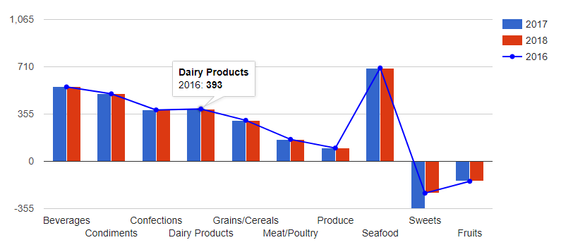
ComboChart
ComboChart
- Christian K
Owned by Christian K
Inhalt:
Beispiel füllen der Daten:
//Each combochart needs a basic type
//Possible types: SeriesType.BARS, SeriesType.AREA, SeriesType.STEPPED_AREA, SeriesType.LINE, SeriesType.CANDLESTICKS
this.comboChart.setSeriesType(SeriesType.BARS);
//Further an unlimited amount of subseries can be added
//The first parameter "Index", defines the column. In the following case, the "avarage" column.
this.comboChart.addSeries(5, ComboSeries.New(SeriesType.LINE));

final ChartModel model = ChartModel.New()
	.addColumn(Column.New(Type.STRING, "year", "Jahr"))
	.addColumn(Column.New(Type.NUMBER, "bolivia", "Bolivia"))
	.addColumn(Column.New(Type.NUMBER, "ecuador", "Ecuador"))
	.addColumn(Column.New(Type.NUMBER, "madagascar", "Madagascar"))
	.addColumn(Column.New(Type.NUMBER, "papua New Guinea", "Papua New Guinea"))
	.addColumn(Column.New(Type.NUMBER, "rwanda", "Rwanda"))
	.addColumn(Column.New(Type.NUMBER, "average", "Average"));

model.addRow("2004/05", 165, 938, 522, 998, 450, 614.6);
model.addRow("2005/06", 135, 1120, 599, 1268, 288, 682);
model.addRow("2006/07", 157, 1167, 587, 807, 397, 623);
model.addRow("2007/08", 139, 1110, 615, 968, 215, 609.4);
model.addRow("2008/09", 136, 691, 629, 1026, 366, 569.6);

//Setzen des Models
comboChart.setModel(model);
API und Methoden:
Properties | |
|---|---|
| Series Configuration | As mentioned above a series is like a native Bar-, Line-, Area-, SteppedArea- or CandlestickChart. Because of this they have the same posibilities form configuration. Here an example: ComboSeries series = ComboSeries.Builder()
.areaOpacity(0.5)
.color("red")
.curveType(CurveType.FUNCTION)
.labelInLegend(true)
.lineDashStyle(Arrays.asList(4,4,4))
.lineWidth(5)
.build();
this.comboChart.addSeries(5, series);
And there are a lot more properties to configure specific series. See LineChart, BarChart, AreaChart, CandlestickChart |
XDEV Software Corp. - One Embarcadero Center, San Francisco, CA 94111, US
Copyright © 2015. XDEV Software Corp. All rights reserved.