/
BubbleChart
BubbleChart
- Christian K
Owned by Christian K
Inhalt:
Optimale Datenstruktur (Datenbank):
| Beschriftung | X-Axis | Y-Axis | Kategorie | BubbleGröße |
|---|---|---|---|---|
| "DEU" | 68.49 | 2.96 | "Europe" | 61801570 |
| "GBR" | 79.66 | 1.67 | "Europe" | 81902307 |
| "ISR" | 78.09 | 2.78 | "Middle East" | 31090763 |
| ... |
Optimale Objektstruktur (Java)
public class BubbleChartObject {
	private String description;
	private Double x_value;
	private Double y_value;
	private String category;
	private Double bubbleValue;

	public String getDescription() {
		return description;
	}

	public void setDescription(String description) {
		this.description = description;
	}

	public Double getX_value() {
		return x_value;
	}

	public void setX_value(Double x_value) {
		this.x_value = x_value;
	}

	public Double getY_value() {
		return y_value;
	}

	public void setY_value(Double y_value) {
		this.y_value = y_value;
	}

	public String getCategory() {
		return category;
	}

	public void setCategory(String category) {
		this.category = category;
	}

	public Double getBubbleValue() {
		return bubbleValue;
	}

	public void setBubbleValue(Double bubbleValue) {
		this.bubbleValue = bubbleValue;
	}
}
Beispiel: Füllen der Daten
final ChartModel model = ChartModel.New()..addColumn(Column.New(Type.STRING, "bubbletext", "Bubbletext"))
.addColumn(Column.New(Type.NUMBER, "x-value", "X-Axis"))
.addColumn(Column.New(Type.NUMBER, "x-value", "Y-Axis"))
.addColumn(Column.New(Type.STRING, "category", "Category"))
.addColumn(Column.New(Type.NUMBER, "bubblesize", "Bubblesize"));
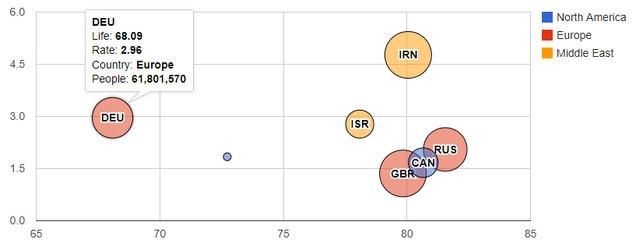
model.addRow("CAN", 80.66, 1.67, "North America", 33739900d);
model.addRow("GBR", 79.84, 1.36, "Europe", 81902307d);
model.addRow("USA", 72.73, 1.84, "North America", 5523095d);
model.addRow("IRN", 80.05, 4.77, "Middle East", 79716203d);
model.addRow("DEU", 68.09, 2.96, "Europe", 61801570d);
model.addRow("RUS", 81.55, 2.05, "Europe", 73137148d);
model.addRow("ISR", 78.09, 2.78, "Middle East", 31090763d);
this.bubbleChart.setModel(model);
API und Methoden:
| Properties | |
|---|---|
| SortBubblesBySize | The orientation of the chart. When set to this.barChart.setOrientation(Orientation.VERTICAL); |
, multiple selections available,
Related content
BubbleChart
BubbleChart
More like this
XdevBubbleChart
XdevBubbleChart
More like this
OrgChart
More like this
OrgChart
More like this
XdevOrgChart
XdevOrgChart
More like this
BarChart / ColumnChart
BarChart / ColumnChart
More like this
XDEV Software Corp. - One Embarcadero Center, San Francisco, CA 94111, US
Copyright © 2015. XDEV Software Corp. All rights reserved.