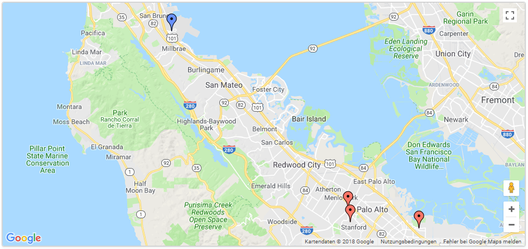
MapChart
Inhalt:
Achtung: Für die Verwendung der XdevGeoChart oder XdevMapChart ist ein Google API-Key erforderlich. Dieser API-Key kann hier angefordert werden.
Optimale Datenstruktur (Datenbank):
| Lat | Long | Beschriftung |
|---|---|---|
| 37.4232 | -122.0853 | "Work" |
| 37.4289 | -122.1697 | "University" |
| 37.6153 | -122.3900 | "Airport" |
| ... |
oder
| Adresse | Beschriftung |
|---|---|
| "Musterweg 16 92225 Musterndorf" | "Work" |
Optimale Objektstruktur (Java)
public class MapChartObject {
	private Double longitude;
	private Double latitude;
	private String name;

	public Double getLongitude() {
		return longitude;
	}

	public void setLongitude(Double longitude) {
		this.longitude = longitude;
	}

	public Double getLatitude() {
		return latitude;
	}

	public void setLatitude(Double latitude) {
		this.latitude = latitude;
	}

	public String getName() {
		return name;
	}

	public void setName(String name) {
		this.name = name;
	}
}
Beispiel: Füllen der Daten
//Beim Instanziieren muss das DataMapFormat definiert werden
//DataMapFormat.Latitude --> Definition der Orte über "Long" and "Lat"
//DataMapFormat.Address --> Definition der Orte die Adresse z.B. "Mustersweg 16 92224 Musterndorf"
final ChartModel model = ChartModel.New()
	.addColumn(Column.New(Column.Type.NUMBER, "longitude"))
	.addColumn(Column.New(Column.Type.NUMBER, "latitude"))
	.addColumn(Column.New(Column.Type.STRING, "Beschriftung"));

model.addRow(37.4232, -122.0853, "Work");
model.addRow(37.4289, -122.1697, "University");
model.addRow(37.6153, -122.3900, "Airport");
model.addRow(37.4422, -122.1731, "Shopping");

mapChart.setModel(model);
API und Methoden:
| Properties | |
|---|---|
| API Key | For some charts a API Key from Goofle is nessesary. You can get a key here: https://developers.google.com/maps/documentation/javascript/get-api-key mapsChart.setMapsApiKey("123456789wertzuiopü");
|
| MapType | The type of map to show. Possible values are 'normal', 'terrain', 'satellite', 'hybrid', or the ID of a custom map type, if any were created. mapsChart.setMapType("normal");
|
| ShowInfoWindow | If set to true, shows the location description in a separate window when a point marker is selected by the user. mapsChart.setShowInfoWindow(true); |
| ShowLine | If set to true, shows a Google Maps polyline through all the points. mapsChart.setShowLine(true); |
| ShowTooltip | If set to true, shows the location description as a tooltip when the mouse is positioned above a point marker. This option used to be called mapsChart.setShowTooltip(true); |
| UseMapTypeControl | Show a map type selector that enables the viewer to switch between [map, satellite, hybrid, terrain]. When useMapTypeControl is false (default) no selector is presented and the type is determined by the mapType option. mapsChart.setUseMapTypeControl(true); |
| ZoomLevel | An integer indicating the initial zoom level of the map, where 0 is completely zoomed out (whole world) and 19 is the maximum zoom level. (See "Zoom Levels" in the Google Maps API.) mapsChart.setZoomLevel(8); |
| EnableScrollWheel | If set to true, enables zooming in and out using the mouse scroll wheel. mapsChart.setEnableScrollWheel(true); |
XDEV Software Corp. - One Embarcadero Center, San Francisco, CA 94111, US
Copyright © 2015. XDEV Software Corp. All rights reserved.