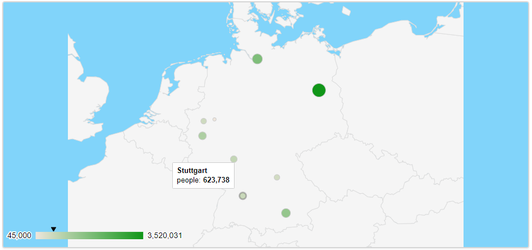
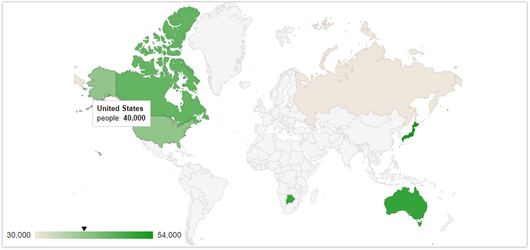
GeoChart
- Christian K
Inhalt:
Achtung: Für die Verwendung der XdevGeoChart oder XdevMapChart ist ein Google API-Key erforderlich. Dieser API-Key kann hier angefordert werden.
Optimale Datenstruktur (Datenbank):
| Beschriftung | X-Axis |
|---|---|
| "United States" | 327414000 |
| "Japan" | 126490000 |
| "Russia" | 146877088 |
| ... |
Optimale Objektstruktur (Java)
public class GeoChartObject {
	private String country;
	private Integer value;

	public String getCountry() {
		return country;
	}

	public void setCountry(String country) {
		this.country = country;
	}

	public Integer getValue() {
		return value;
	}

	public void setValue(Integer value) {
		this.value = value;
	}
}
Beispiel: Füllen der Daten
Hier finden Sie eine Liste aller validen Codes und Countries: Ländercodes
final ChartModel model = ChartModel.New()
	.addColumn(Column.New(Column.Type.STRING, "Country"))
	.addColumn(Column.New(Column.Type.NUMBER, "Popularity"));

model.addRow("Germany", 200);
model.addRow("United States", 300);
model.addRow("Brazil", 400);
model.addRow("Canada", 500);
model.addRow("France", 600);
model.addRow("RU", 700);
API und Methoden:
| Properties | |
|---|---|
| API Key | For some charts a API Key from Goofle is nessesary. You can get a key here: https://developers.google.com/maps/documentation/javascript/get-api-key geoChart.setMapsApiKey("123456789wertzuiopü");
|
| DatalessRegionColor | Color to assign to regions with no associated data. geoChart.setDatalessRegionColor("white");
|
| DefaultColor | The color to use when for data points in a geochart when the location (e.g., geoChart.setDefaultColor("white");
|
| DisplayMode | Which type of geochart this is. The DataTable format must match the value specified. The following values are supported:
|
| MarkerOpacy | The opacity of the markers, where 0.0 is fully transparent and 1.0 is fully opaque. geoChart.setMarkerOpacity(0.8); |
| Resolution | The resolution of the geochart borders. Choose one of the following values:
geoChart.setResolution(Resolution.COUNTRIES); |
| MagnifyingGlass | If true, when the user lingers over a cluttered marker, a magnifiying glass will be opened. Note: this feature is not supported in browsers that do not support SVG, i.e. Internet Explorer version 8 or earlier. geoChart.setMagnifyingGlass(MagnifyingGlass.New(true, 5)); |
XDEV Software Corp. - One Embarcadero Center, San Francisco, CA 94111, US
Copyright © 2015. XDEV Software Corp. All rights reserved.