/
TimelineChart
TimelineChart
- Christian K
Owned by Christian K
Last updated: Apr 09, 2020
Inhalt:
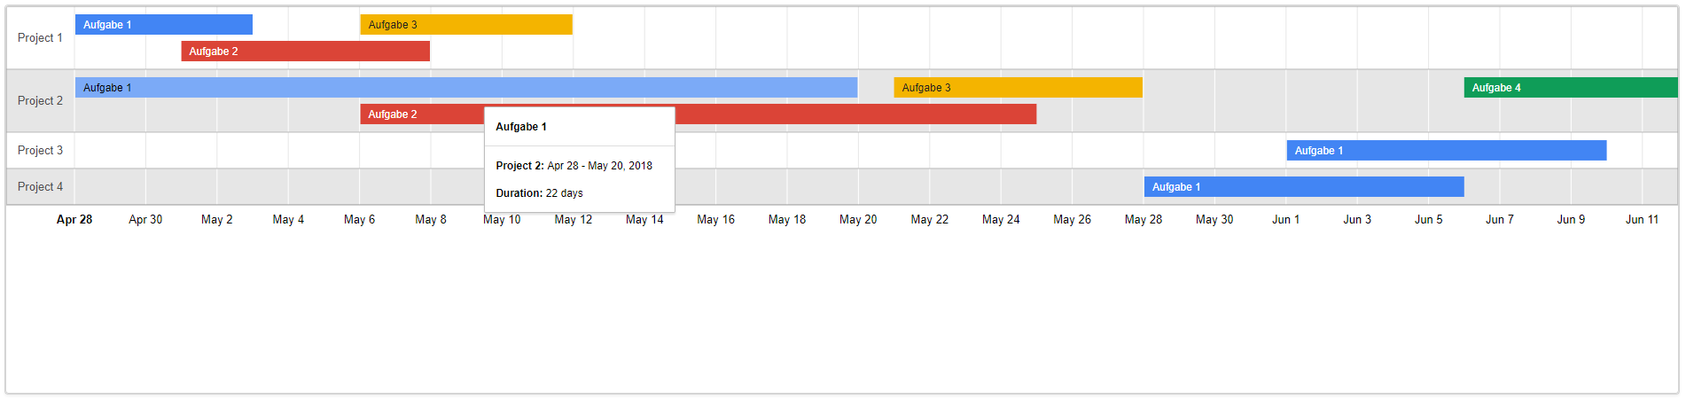
Optimale Datenstruktur (Datenbank):
| Kategorie 1 - y-Achse | Kategorie - x-Achse | Beginn | Ende |
|---|---|---|---|
| Projekt 1 | Aufgabe 1 | 28.04.2018 | 03.05.2018 |
| Projekt 1 | Aufgabe 2 | 01.05.2018 | 08.05.2018 |
| Projekt 1 | Aufgabe 3 | 06.05.2018 | 12.05.2018 |
| Projekt 2 | Aufgabe 1 | 28.04.2018 | 20.05.2018 |
| Projekt 2 | Aufgabe 2 | 06.05.2018 | 25.05.2018 |
Optimale Objektstruktur (Java):
public class TimelineChartObject {
	private String y_category;
	private String x_category;
	private LocalDate start;
	private LocalDate end;

	public String getX_category() {
		return x_category;
	}

	public void setX_category(String x_category) {
		this.x_category = x_category;
	}

	public String getY_category() {
		return y_category;
	}

	public void setY_category(String y_category) {
		this.y_category = y_category;
	}

	public LocalDate getStart() {
		return start;
	}

	public void setStart(LocalDate start) {
		this.start = start;
	}

	public LocalDate getEnd() {
		return end;
	}

	public void setEnd(LocalDate end) {
		this.end = end;
	}
}
Beispiel füllen der Daten:
//Erstellen Model
final ChartModel model = ChartModel.New()
	.addColumn(Column.New(Type.STRING, "project", "project"))
	.addColumn(Column.New(Type.STRING, "task", "Task"))
	.addColumn(Column.New(Type.DATE, "from", "From"))
	.addColumn(Column.New(Type.DATE, "to", "To"));

model.addRow("Project 1", "Aufgabe 1", LocalDate.of(2018, 4, 28), LocalDate.of(2018, 5, 3));
model.addRow("Project 1", "Aufgabe 2",LocalDate.of(2018, 5, 1), LocalDate.of(2018, 5, 8));
model.addRow("Project 1", "Aufgabe 3",LocalDate.of(2018, 5, 6), LocalDate.of(2018, 5, 12));
model.addRow("Project 2", "Aufgabe 1",LocalDate.of(2018, 4, 28), LocalDate.of(2018, 5, 20));
model.addRow("Project 2", "Aufgabe 2",LocalDate.of(2018, 5, 6), LocalDate.of(2018, 5, 25));
model.addRow("Project 2", "Aufgabe 3",LocalDate.of(2018, 5, 21), LocalDate.of(2018, 5, 28));
model.addRow("Project 2", "Aufgabe 4",LocalDate.of(2018, 6, 6), LocalDate.of(2018, 6, 12));
model.addRow("Project 3", "Aufgabe 1",LocalDate.of(2018, 6, 1), LocalDate.of(2018, 6, 10));
model.addRow("Project 4", "Aufgabe 1",LocalDate.of(2018, 5, 28), LocalDate.of(2018, 6, 6));

//Setzen des Models
timelineChart.setModel(model);
API und Methoden:
Properties | |
|---|---|
| AvoidOverlappingGridlines | Google Charts makes tiny adjustments to bar endpoints to avoid obscuring timeline gridlines. To prevent this behavior, set the timelineChart.setAvoidOverlappingGridLines(true); |
| CustomizeTimeline | Example final Timeline timeline = Timeline.Builder() .showRowLabels(true) .colorByRowLabel(true) .groupByRowLabel(true) .build(); this.timelineChart.setTimeline(timeline); For more detailed informations see: https://developers.google.com/chart/interactive/docs/gallery/timeline |
, multiple selections available,
Related content
TimelineChart
TimelineChart
More like this
LineChart
LineChart
More like this
LineChart
LineChart
More like this
XdevTimelineChart
XdevTimelineChart
More like this
AreaChart
AreaChart
More like this
AreaChart
AreaChart
More like this
XDEV Software Corp. - One Embarcadero Center, San Francisco, CA 94111, US
Copyright © 2015. XDEV Software Corp. All rights reserved.