Inhalt:
Füllen von Daten
Properties
Allgemein
Detailierte Information finden Sie zusätzlich hier: https://developers.google.com/chart/interactive/docs/gallery/ganttchart
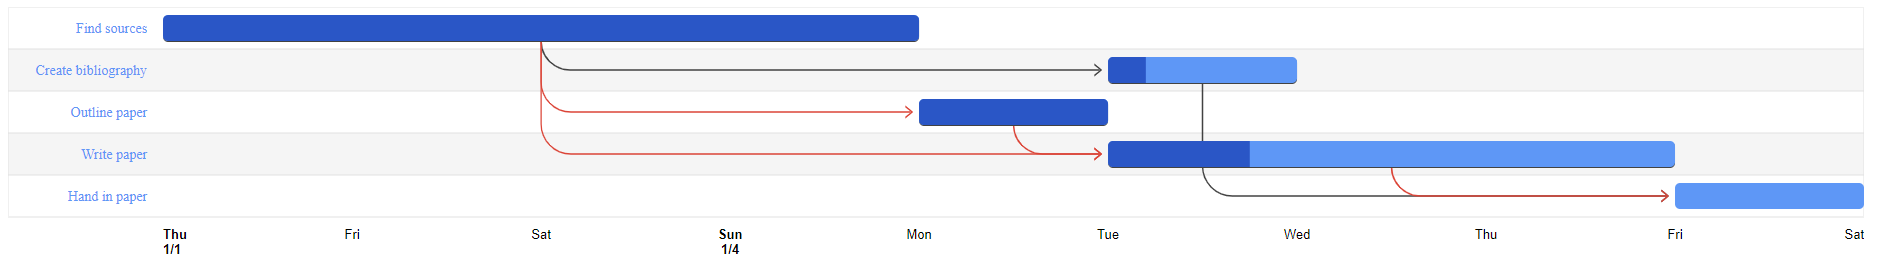
Beispiel: Füllen der Daten
final ChartModel model = ChartModel.New()
	.addColumn(Column.New(Column.Type.STRING, "topic", "topic"))
	.addColumn(Column.New(Column.Type.STRING, "task", "task"))
	.addColumn(Column.New(Column.Type.DATE, "startDate", "startDate"))
	.addColumn(Column.New(Column.Type.DATE, "endDate", "endDate"))
	.addColumn(Column.New(Column.Type.NUMBER, "duration", "duration"))
	.addColumn(Column.New(Column.Type.NUMBER, "percentcomplete", "percentcomplete"))
	.addColumn(Column.New(Column.Type.STRING, "dependencies", "dependencies"));

model.addRow("Research", "Find sources",
	LocalDate.of(2015, 1, 1), LocalDate.of(2015, 1, 5), null, 100, null);
model.addRow("Write", "Write paper",
	null, LocalDate.of(2015, 1, 9), Duration.ofDays(3).toMillis(), 25, "Research,Outline");
model.addRow("Cite", "Create bibliography",
	null, LocalDate.of(2015, 1, 7), Duration.ofDays(1).toMillis(), 20, "Research");
model.addRow("Complete", "Hand in paper",
	null, LocalDate.of(2015, 1, 10), Duration.ofDays(1).toMillis(), 0, "Cite,Write");
model.addRow("Outline", "Outline paper",
	null, LocalDate.of(2015, 1, 6), Duration.ofDays(1).toMillis(), 100, "Research");

this.ganttChart.setModel(model);
|
API und Methoden:
Properties | |
|---|---|
Gantt Arrow Configuration | For Gantt Charts, Examle: final Arrow arrow = Arrow.Builder()
.angle(1) //The angle of the head of the arrow.
.color("blue") //The color of the arrows.
.length(4) //The length of the head of the arrow.
.width(3) //The width of the arrows.
.radius(0) //The radius for defining the curve of the arrow between two tasks.
.spaceAfter(3) //The amount of whitespace between the head of an arrow and the task to which it points.
.build();
|
Gantt Configuration | Example: final Gantt gantt = Gantt.Builder()
.arrow(arrow)
.barCornerRadius(0) //The radius for defining the curve of a bar's corners.
.barHeight(15) //The height of the bars for tasks.
.criticalPathEnabled(true) //If true any arrows on the critical path will be styled differently.
.criticalPathStyle(LineStyle.New("red", 3)) //An object containing the style for any critical path arrows.
.defaultStartDate(DateValue.Date(LocalDate.now())) //If the start date cannot be computed from the values in the DataTable, the start date will be set to this.
.innerGridDarkTrack(BarStyle.New("white")) //The fill color of the inner grid track.
.innerGridHorizLine(LineStyle.New("black", 3)) //Defines the style of the inner horizontal grid lines.
.innerGridTrack(BarStyle.New("gray")) //The fill color of the inner grid track.
.labelStyle(TextStyle.New("black", "Arial", 12)) //An object containing the styles for task labels.
.labelMaxWidth(20) //The maximum amount of space allowed for each task label.
.percentEnabled(true) //Fills the task bar based on the percentage completed for the task.
.shadowColor("blue") //Defines the color of the shadows under any task bar which has dependencies.
.shadowEnabled(true) //If set to true, draws a shadow under each task bar which has dependencies.
.shadowOffset(4) //Defines the offset, in pixels, of the shadows under any task bar which has dependencies.
.trackHeight(40) //The height of the tracks.
.build();
this.ganttChart.setGantt(gantt);
|