/
XdevCandlestickChart
XdevCandlestickChart
- Christian K
Owned by Christian K
Inhalt:
- Daten- / Objektstruktur
- Füllen von Daten
- Chartkonfiguration
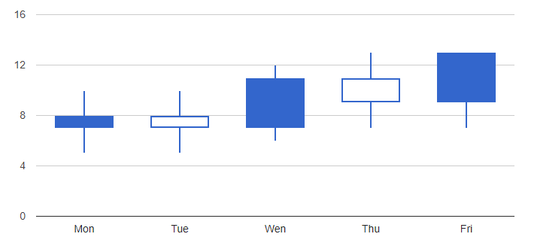
Optimale Datenstruktur (Datenbank):
| Beschriftung | min | max | open | close |
|---|---|---|---|---|
| "Mon" | 5 | 10 | 7 | 8 |
| "Tue" | 5 | 10 | 8 | 7 |
| "Wen" | 6 | 12 | 7 | 11 |
| "Thu" | 7 | 13 | 11 | 9 |
| "Fri" | 7 | 13 | 9 | 13 |
Optimale Objektstruktur (Java)
public class CandlestickChartObject {
	private String caption;
	private Double min;
	private Double max;
	private Double open;
	private Double close;

	public String getCaption() {
		return this.caption;
	}

	public void setCaption(final String caption) {
		this.caption = caption;
	}

	public Double getMin() {
		return this.min;
	}

	public void setMin(final Double min) {
		this.min = min;
	}

	public Double getMax() {
		return this.max;
	}

	public void setMax(final Double max) {
		this.max = max;
	}

	public Double getOpen() {
		return this.open;
	}

	public void setOpen(final Double open) {
		this.open = open;
	}

	public Double getClose() {
		return this.close;
	}

	public void setClose(final Double close) {
		this.close = close;
	}
}
Beispiel: Füllen der Daten
XdevCandleStickModel model = new XdevCandleStickModel();

model.addItem("Mon", 5, 10, 7, 8);
model.addItem("Tue", 5, 10, 8, 7);
model.addItem("Wen", 6, 12, 7, 11);
model.addItem("Thu", 7, 13, 11, 9);
model.addItem("Fri", 7, 13, 9, 13);
API und Methoden:
Füllen der Daten
model.addItem("Mon", 5, 10, 7, 8);

//Parameter 1 ("Mon"): Beschriftung / Caption
//Parameter 2 (5): Min Value / Lunte
//Parameter 3 (10): Max Value / Docht
//Parameter 4 (7): Open Value / Eröffnung
//Parameter 5 (8): Close Value / Schluss
Positionierung und Größe des Chart innerhalb des Chartbereichs
XdevCandleStickChartConfig config = new XdevCandleStickChartConfig();

final ChartArea area = new ChartArea();

area.setHeigth("100"); //Höhe des Chart
area.setWidth("100"); //Breite des Chart
area.setLeft("100"); //Abstand des Chart von Links in Pixel
area.setRight("100"); //Abstand des Chart von Links in Pixel
area.setTop("100"); //Abstand des Chart von Links in Pixel

config.setChartArea(area);
Konfiguration Farben
XdevCandleStickChartConfig config = new XdevCandleStickChartConfig();

config.setBackgroundColor(...); //Siehe API Allgemein "BackgroundStyle"

//Eine Liste an Farben die dann der Reihe nach an die Kategorien vergeben werden
List<String> places = Arrays.asList("#FFFFFF", "Red", "#F4g6uz");
config.setColors(places); //Zuweisen der Farbliste
Konfiguration Texte
XdevCandleStickChartConfig config = new XdevCandleStickChartConfig();

config.setLegend(...); //Siehe API Allgemein "LegendOptions"
config.setTitleTextStyle(...); //Siehe API Allgemein "TextStyle"
config.setFontName(""); //Wahl der Schriftart (Schriftart muss vom Browser unterstützt werden)
config.setFontSize(15); //Setzen allgemeine Schriftgröße im Chart
config.setTitle("Sales Overview"); //Setzen ChartTitel
Konfiguration des Tooltips und wann er angezeigt werden soll
Tooltip tooltip = new Tooltip();

tooltip.setisHtml(true); //Tooltip per HTML Konfigurierbar Ja / Nein
tooltip.setTrigger("focus"); Mögliche Werte: "focus" --> MouseOver, "none" --> kein Tooltip, "selektion" --> MouseKlick

config.setTooltip(tooltip);
, multiple selections available,
Related content
CandlestickChart
CandlestickChart
More like this
CandlestickChart
CandlestickChart
More like this
XdevOrgChart
XdevOrgChart
More like this
XdevLineChart
XdevLineChart
More like this
XdevBarChart
XdevBarChart
More like this
XdevBubbleChart
XdevBubbleChart
More like this
XDEV Software Corp. - One Embarcadero Center, San Francisco, CA 94111, US
Copyright © 2015. XDEV Software Corp. All rights reserved.